As the drive for cleaner motoring continues, taxi drivers are already ahead of the curve when it comes to using less-polluting vehicles.
The Government’s Taxi and private hire vehicle statistics, England: 2023 report, which was published last month, offers a fascinating insight into the makeup of the taxi and private hire fleets.
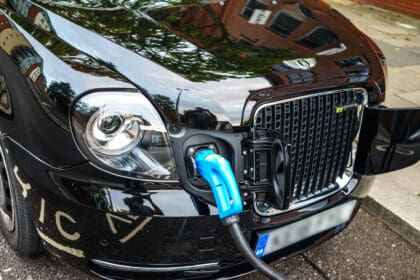
One of the first figures to jump out is that taxi drivers and private hire drivers continue to turn to hybrids and EVs as they steer away from petrol and diesel vehicles.
The report shows that from 2020 to 2023, the proportion of public hire taxis using petrol and diesel fell from 89% in 2020 to 77% in 2023.
In the same period, the proportion of hybrid vehicles doubled from 10% in 2020 to 22% in 2023, while the proportion of battery electric vehicles increased four-fold, from 0.2% in 2020 to 0.8% in 2023.
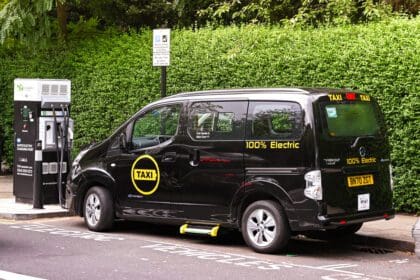
In the private hire sector, the most common fuel type category on March 31, 2023, was petrol and diesel (53%) with hybrid vehicles making up 40% of the fleet, and 6.4% were EVs.
At the same time, the proportion of PHVs using petrol and diesel fell from 65% in 2020 to 53% in 2023. The proportion of hybrid vehicles increased slightly from 34% in 2020 to 40% in 2023, and the proportion of EVs increased eight-fold from 0.8% in 2020 to 6.4% in 2023.
The Government compared these figures to the rest of the car-driving population and found that the taxi fleet has about four times the proportion of hybrid vehicles (22%), but about half the proportion of battery electric vehicles (0.8%).
The comparison is higher with PHV drivers, who favour hybrids for their economy. Compared to the overall car fleet, the PHV fleet has about eight times the proportion of hybrid vehicles (40%), and about three times the proportion of electric vehicles (6.4%).
It is interesting that a smaller percentage of taxi drivers have made the switch to EVs compared to the private car market. This is probably because of concerns about vehicle range and charging which have been well documented.
The report also paints a picture of the country’s taxi fleet as a whole, which currently stands at 289,400 licensed taxis and PHVs in England. Almost one fifth (57,200) of these vehicles have public hire insurance, and the total number of licensed vehicles increased by 11.0% between 2022 and 2023, driven by a 14.6% increase in vehicles with private hire insurance.
While the number of public hire taxis in London increased by 3.4%, it fell 2.9% outside the capital.
The number of PHVs increased to 232,200 – a 14.6% increase from 2022 and there was a larger increase in PHVs in England outside of London (16.8%) compared to 11.3% in the capital.
The report showed there were 346,300 driver licences in England – 16,300 (4.9%) more than in 2022. Of the total licences, 67% were PHV-only licences, 11% were taxi-only licences and 21% were dual taxi and PHV licences which allow the holder to drive both taxis and PHVs.
We recently highlighted the practice of drivers being licenced by one authority while operating in another. The issue was also highlighted by the data which shows that Wolverhampton had the highest number of licensed vehicles per 1,000 population, with 85.3%, compared to several rural areas which have less than one licensed taxi per 1,000 people.
And while most regions saw increases or falls of less than 5%, the West Midlands saw a 28% rise – mainly due to a large increase in Wolverhampton.
The report also looked at the people behind the wheel of a taxi or PHV and found the majority of drivers were male (93%) with an average age of 51.
If the current trends continue, it won’t be long before hybrids make up half of the PHV fleet and, as the range of EVs improves and more charging stations are created, the drive towards fully electric vehicles will also pick up pace.